The essence of good management reporting in 2025
Management reporting is essential in the world of financial management to have complete control over your management reports. A good overview of financial and operational data helps CFOs make informed decisions, identify trends in a timely manner, and optimize their organization’s strategy. In this blog, we explore the core aspects of effective management reporting and show how you can further improve it with smart dashboards and real-time insights.
Written by Thibault Struyve – Reading time: 2 min.
What is Management Reporting?
Management reporting is more than a collection of numbers. It is the process where financial and operational data are brought together, analyzed and presented clearly, so that CFOs and decision-makers quickly gain insight into their organization’s performance. It provides both a look back at the past and a reliable foundation for future planning. With modern tools like BrightAnalytics, these reports become real-time and visually insightful, making complex data immediately understandable and enabling strategic choices to be made faster. This way, CFOs can seize opportunities, limit risks, and steer the organization purposefully.
Important Challenges and Considerations in Sales Reporting
For many CFOs, it is a challenge to get a complete picture of the financial and operational health of their organization. Traditional reports are often scattered across multiple systems and require a lot of manual processing, which is time-consuming and increases the chance of errors. In an environment where real-time insight and reliable data are essential, the need arises for a solution that is both efficient and reliable.
Traditional Reports and Their Limitations
Daily, CFOs work with reports such as profit and loss statements, balance sheets, cash flow overviews, budget versus actual, KPI reports, forecasting, consolidation reports, and operational dashboards. These reports often require manual consolidation of data from different systems and are therefore error-prone and time-intensive.
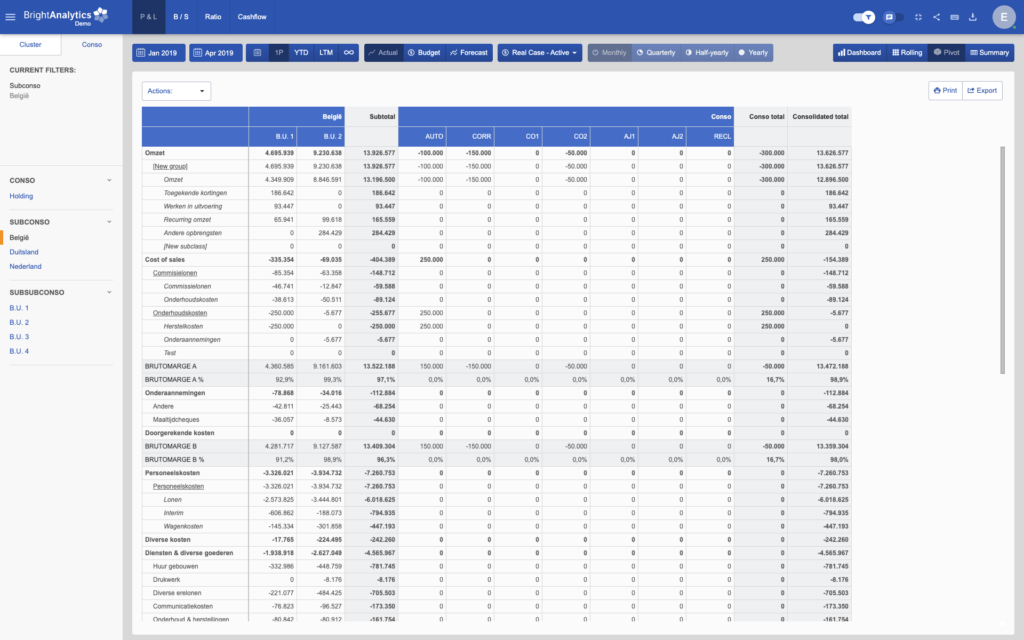
BrightAnalytics replaces these static reports with interactive dashboards that make numbers directly insightful. For example, a profit and loss statement can be converted into a visual dashboard where revenue, costs, and profit per department are visible at a glance. Balance sheets can easily be compared across multiple entities and periods, while important ratios are automatically calculated. Real-time cash flow dashboards give CFOs direct insight into income and expenses, allowing investment or payment decisions to be made faster and more reliably.
Budget versus actual is dynamically updated, KPIs such as revenue growth, customer retention, and project margin can be tracked in one overview, and forecasting dashboards help predict future results based on historical data. Consolidation reports from multiple entities are automatically merged, and operational dashboards show real-time metrics such as inventory levels or project statuses, enabling immediate adjustments.
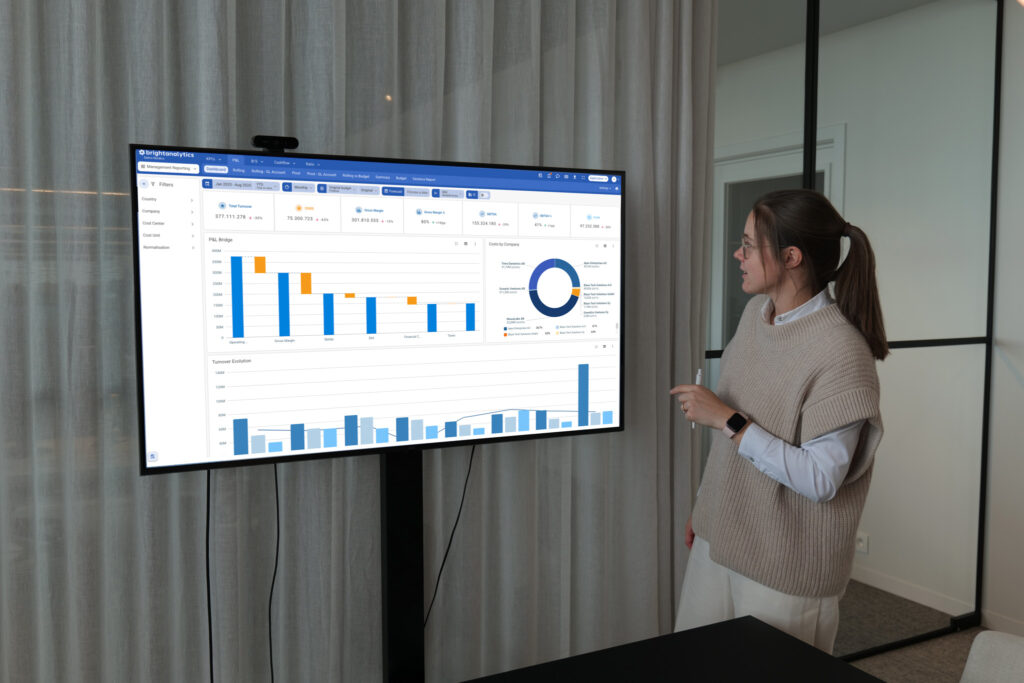
Always Real-Time Overviews in one Platform
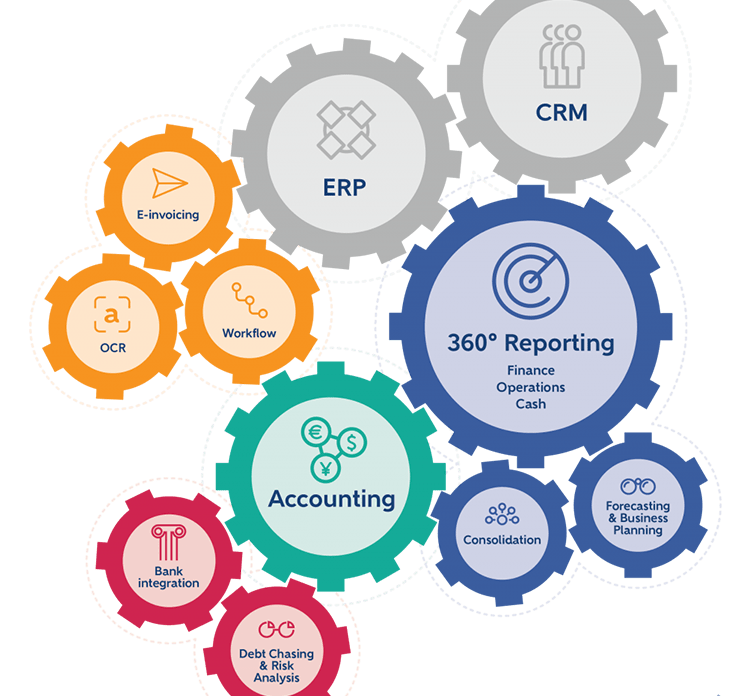
BrightAnalytics brings all financial and operational data together in one clear platform and integrates seamlessly with accounting systems, ERP solutions, and CRM tools. CFOs and their teams get direct access to the most important insights, enabling decisions to be made faster, better informed, and more strategically. Automation of routine tasks saves time, reduces the risk of errors, and gives CFOs more space to focus on analysis and strategy. Thanks to flexibility and scalability, the platform is suitable for both medium-sized and large organizations that want to efficiently manage complex data.
Easy to Start with Complete Control
BrightAnalytics is intuitive and requires no extensive training or technical knowledge. CFOs can easily request a demo and immediately experience how the platform provides real-time insight into financial and operational data and optimizes management reporting. Users retain complete control over what is visible on the dashboard, so it perfectly aligns with their priorities. This way, the CFO stays in control, while the platform supports data-driven and efficient decision-making.